Integration Of Social Network Analysis In Gephi And Tableau Analysis
Dataset: http://bit.ly/1tMEEYK (I don’t own the rights to the dataset please ask permission from @gsiemens or dgasevic before using the dataset as i have permission to use this dataset for a course for analysis in course setting only). This dataset is a hypothetical dataset which contains two different files at different point of a course.
Gephi Analysis
Here are the steps i did in Gephi first
- Imported the two dataset in Gephi. These graph were imported as undirected graphs as there was no directed relationship in them. The nodes were the people who participated in conversations in the course and the edges represented that these two people had a discussion with each other.
- First graph contained 10 nodes and 18 edges, and second one contained 16 nodes and 25 edges. As the dataset is hypothetical we can assume that the first graph was the network after 2 weeks and the second one after 4 weeks in the course.
- Computed Graph Density which calculated betweenness centrality, closeness centrality and eccentricity the three common centrality measures for both graphs separately.
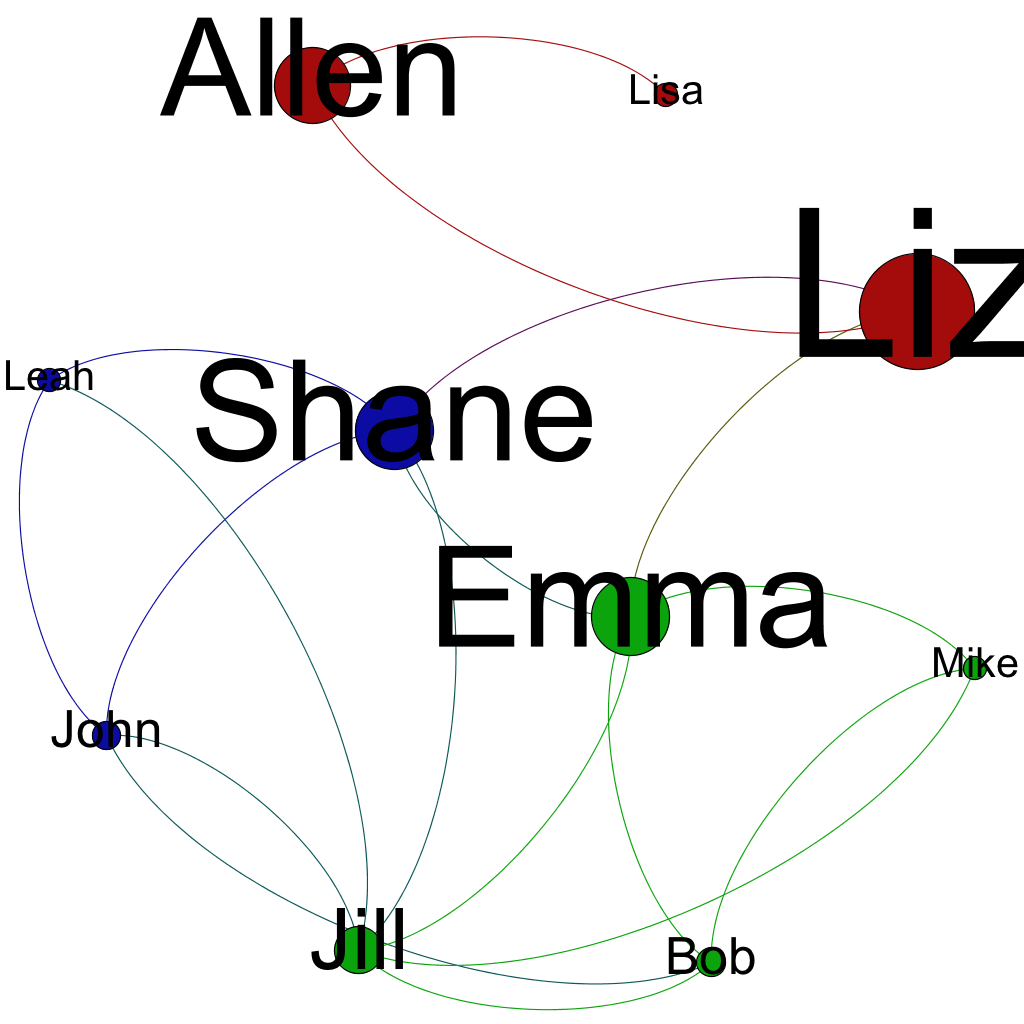
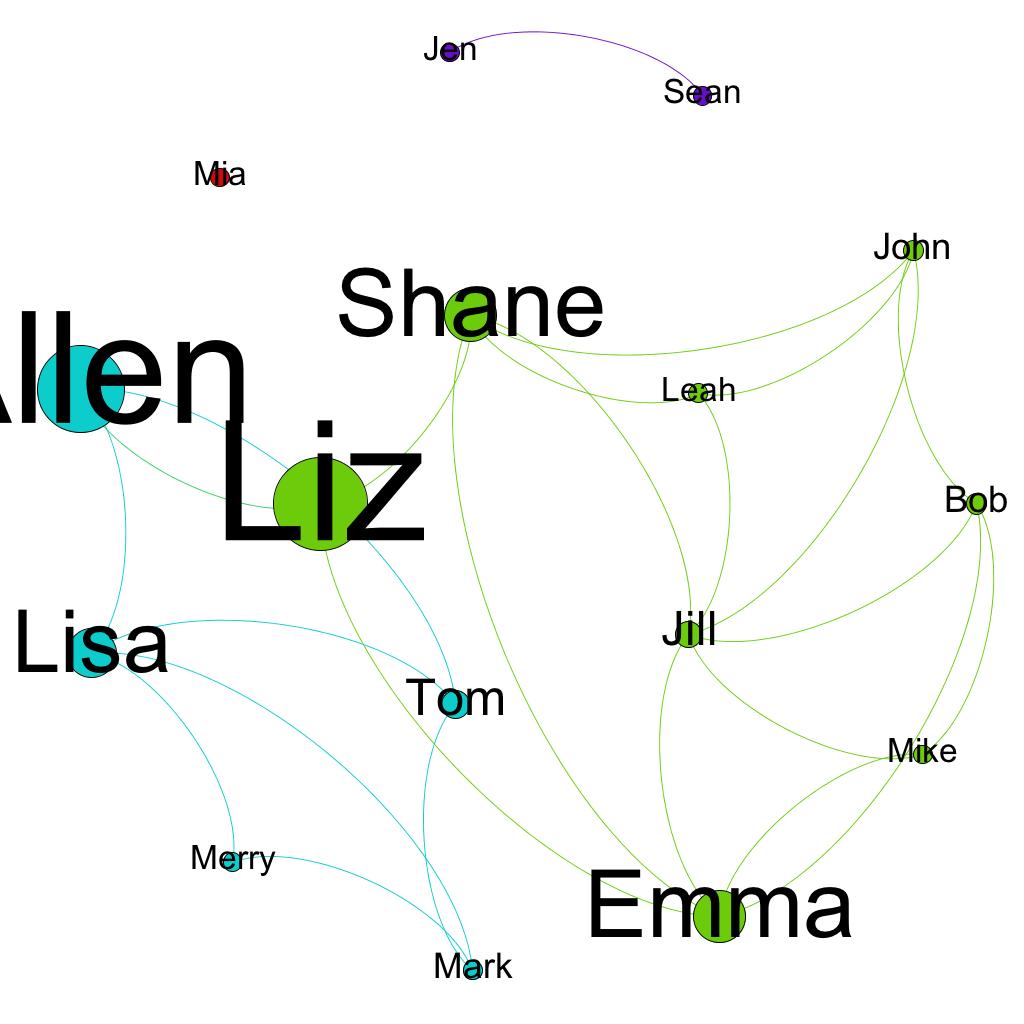
- Next, i used modularity measure in Gephi to calculate communities in both the datasets. There were 3 communities in the first graph, and 4 communities in the second graph. Before we move on to tableau let’s first visualize the graphs to understand the data better.
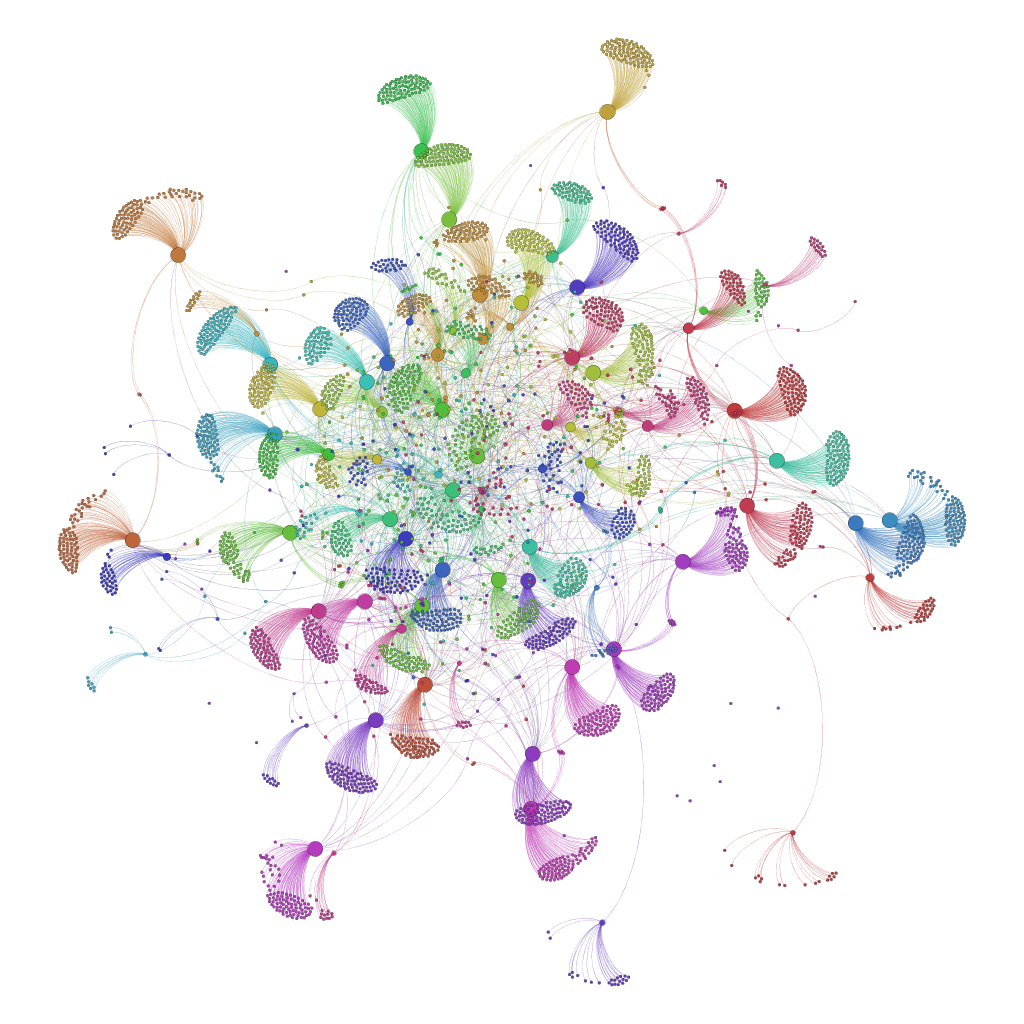
- In the graphs below the color represent that the community, so all nodes with same color belong to same community and the size of the nodes is done by using betweenness centrality measure. The top one was for example1 and the bottom for example2.

Example 1 Communities
Tableau Analysis
You can see the graphs for the distributions for the two weeks in this tableau storyboard. Here is the analysis
- For week 2 the betweenness for 2 groups was very low with some values zero and the last group had a mix of very small and large betweenness values. The only change in week 4 betweenness was the magnitude of large values increased than in week 2.
- For closeness the distribution for both weeks seemed to be uniform distribution.
I have not interpreted the results i will do this once i get more knowledge in learning analytics.


Reblogged this on javed47rashid.