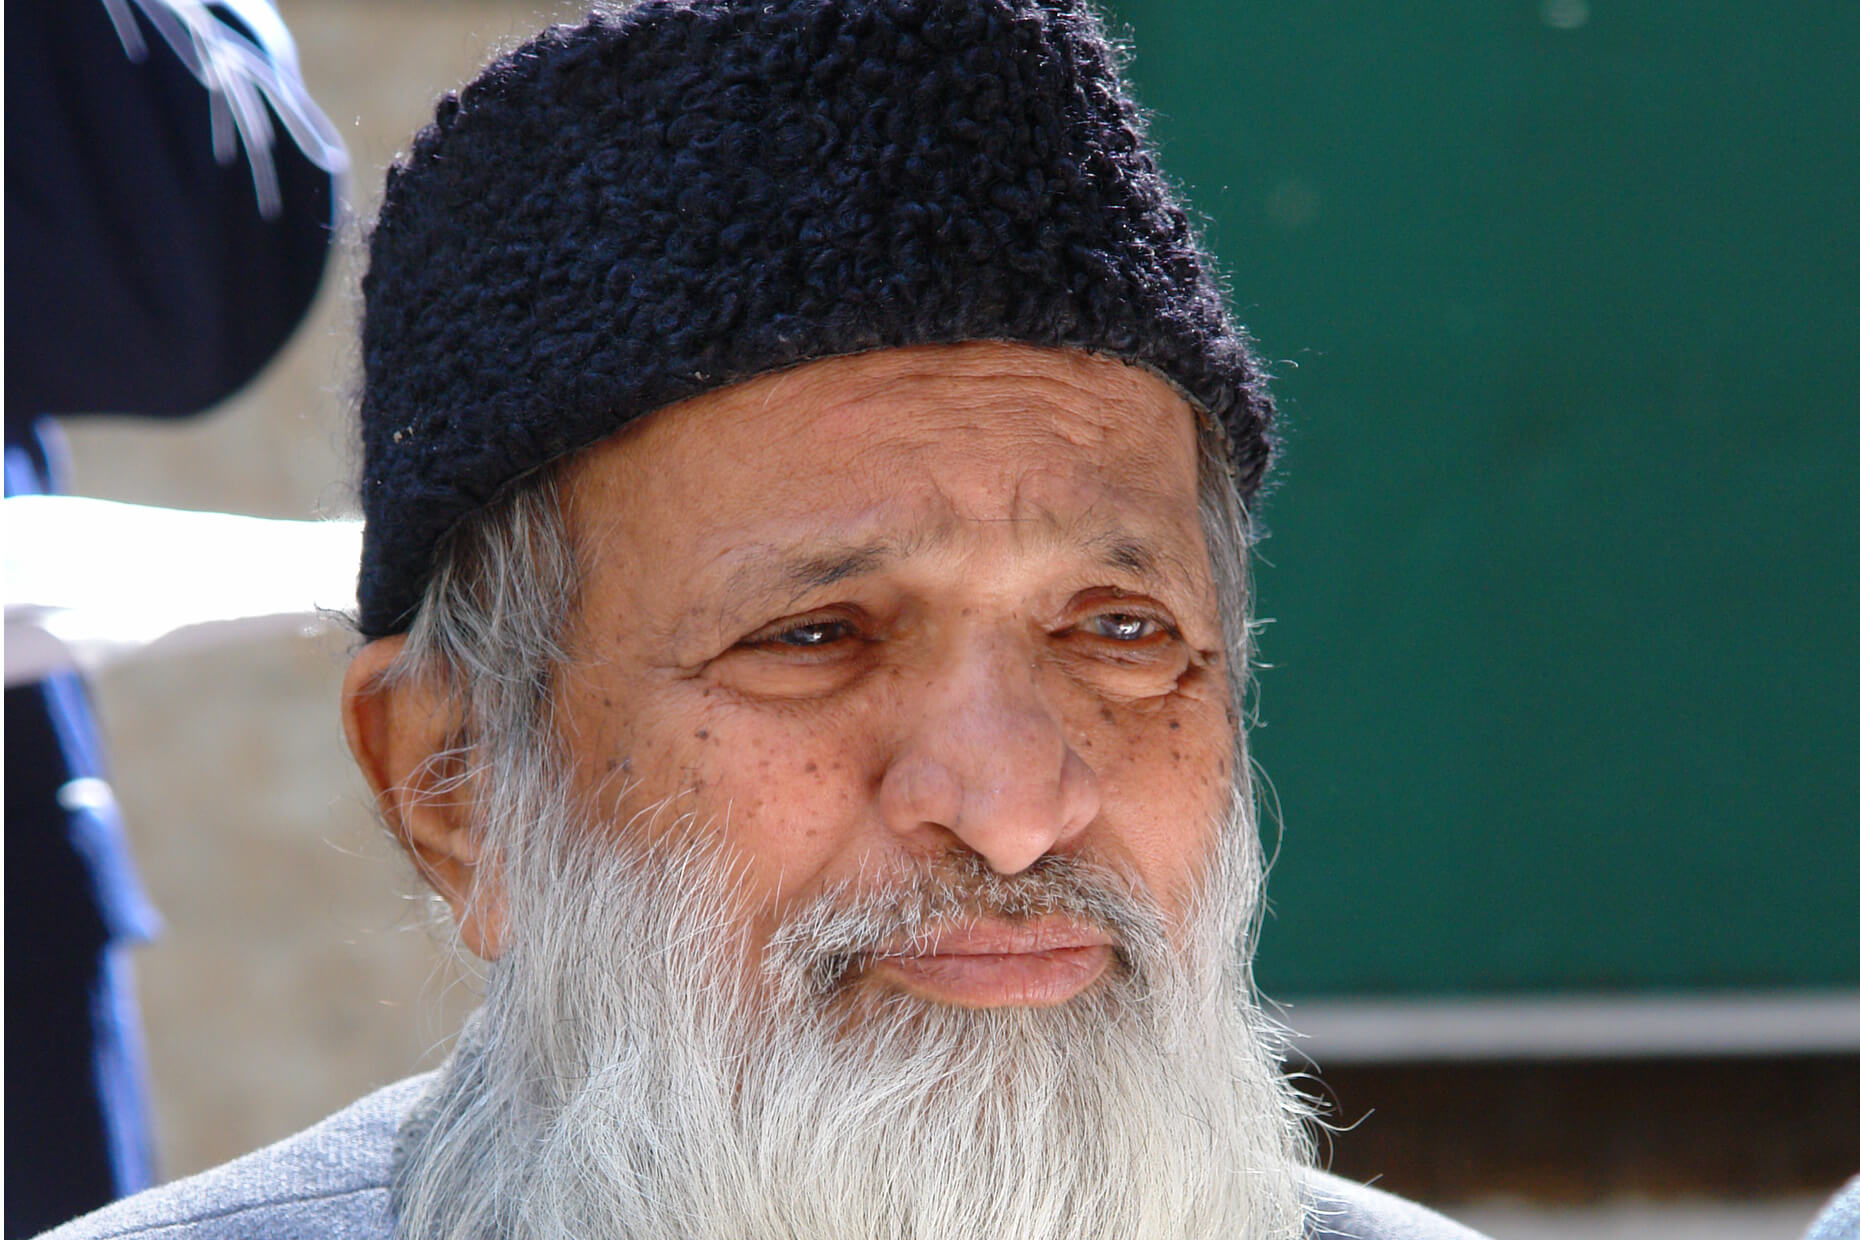
Tribute To Abdul Sattar Edhi
This tribute is created by me using information from Wikipedia.
See the Pen Abdul Sattar Edhi Tribute Page by Jawad Rashid (@jawadrashid2011) on CodePen.
This tribute is created by me using information from Wikipedia.
See the Pen Abdul Sattar Edhi Tribute Page by Jawad Rashid (@jawadrashid2011) on CodePen.
These are the tools which can be used in field of learning analytics.
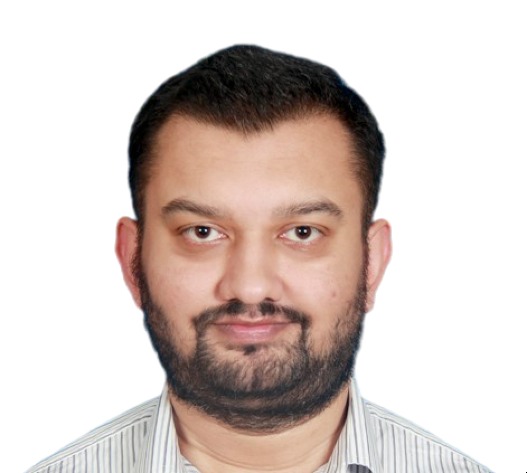
Hi my name is Jawad Rashid. I am currently working in my own company nDataConsulting as a Data Scientist which deals in mainly Big Data technologies, data science, data analysis and visualization. We also develop web applications on the latest technologies both in open source and microsoft technologies. We work on backend MySql, NoSql(Mongo etc), Graph…
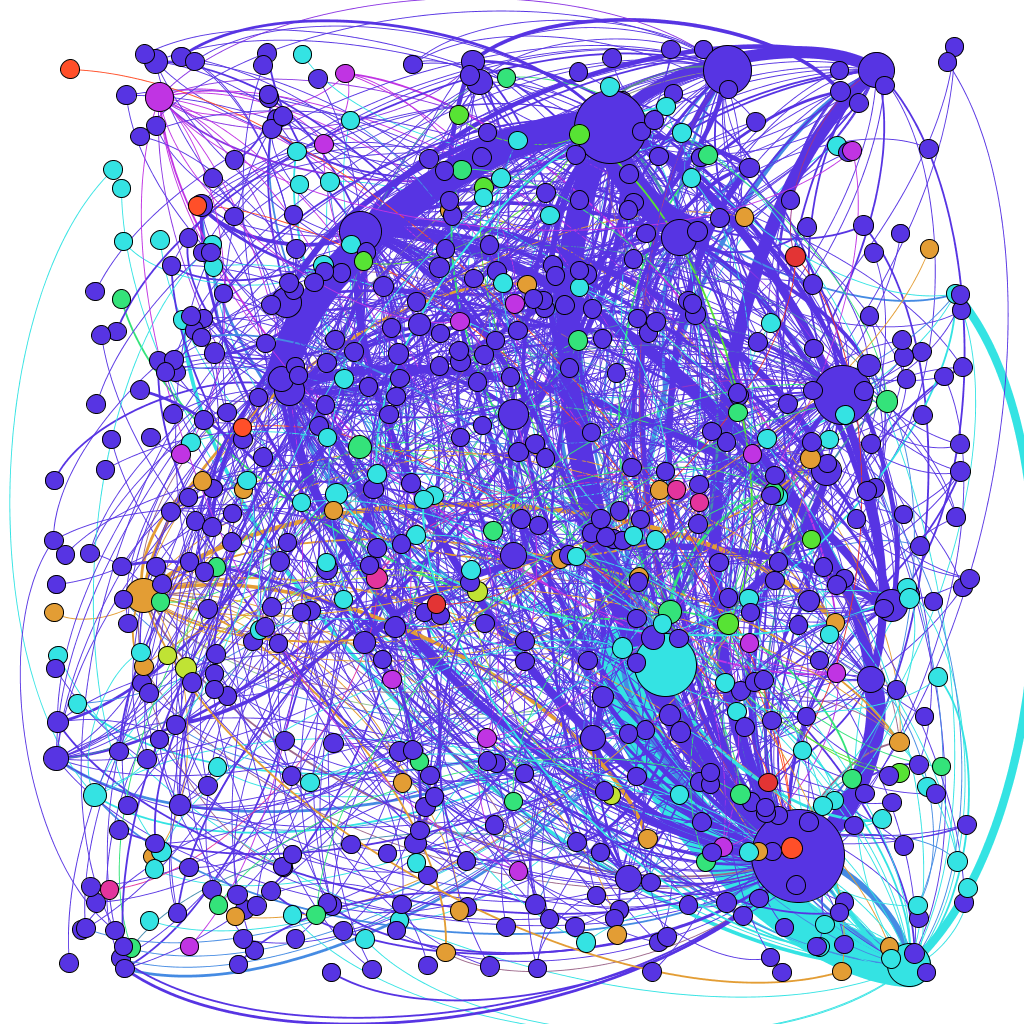
Social network means to take a scenario you want to study, view what kind of interactions are happening in the system and see how to measure the interaction to answer the question we are interested in. Social networking is not limited to just facebook friends and people and how they communicate with each other rather…
I wanted to use Gephi to analyze my twitter and facebook data. I wanted to analyze my connections or any data i can get from my own data. One approach to use my own data which i thought about was that both Facebook and twitter allow your data to be downloaded and twitter nicely gives…
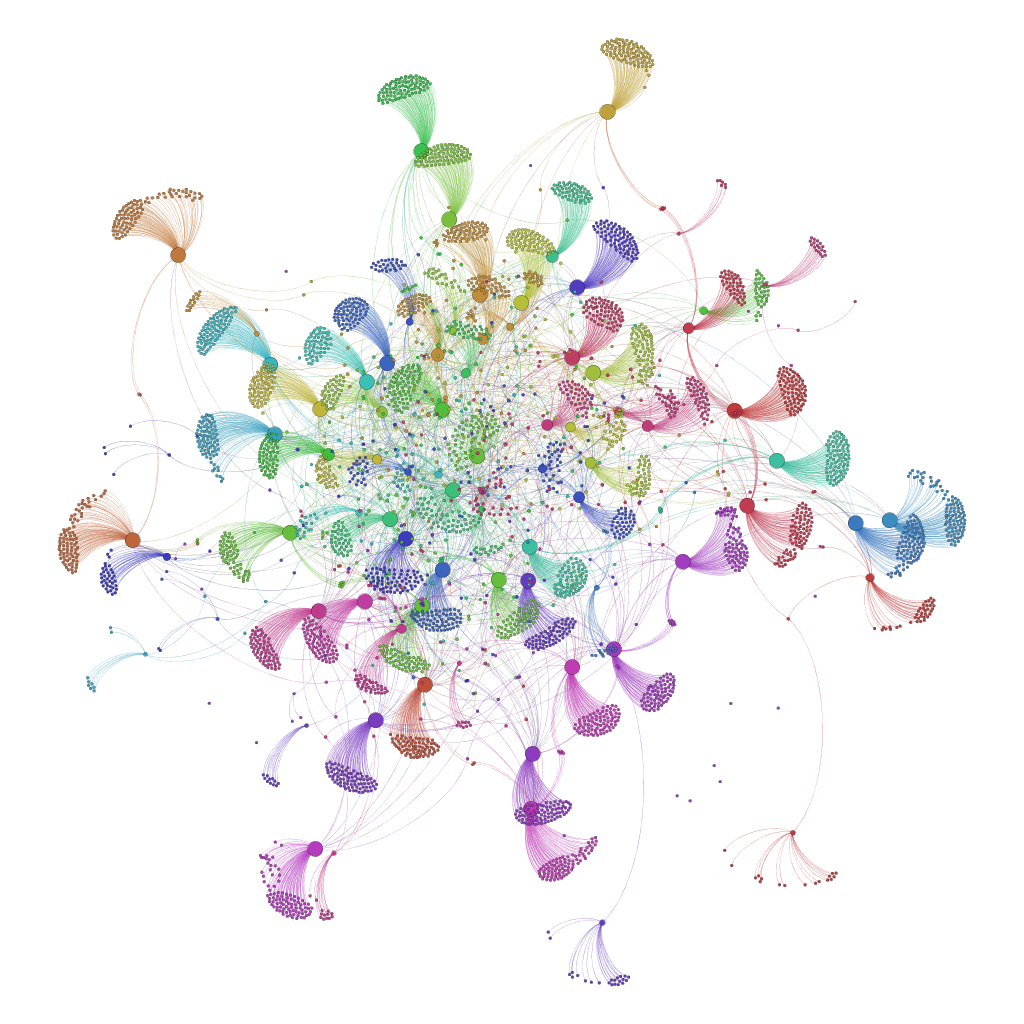
Basically DalMooc is MOOC(massive open online course) with a twist it asks people to use social media to discuss the course. There are different modes of the courses given below:
The dataset used in this analysis is CCK11 dataset for social network analysis (I don’t own the rights to the dataset please ask permission from @gsiemens or dgasevic before using the dataset as i have permission to use this dataset for a course for analysis in course setting only). Don’t use the dataset without the dataset owners permission. I am doing…