CCK11 DATASET
Dataset: http://bit.ly/assig (This dataset is not owned by me and cannot be used without permission from the author that is course on edx dalmooc Data Analytics and Learning Course are the creators for this dataset. Ask their permission first)
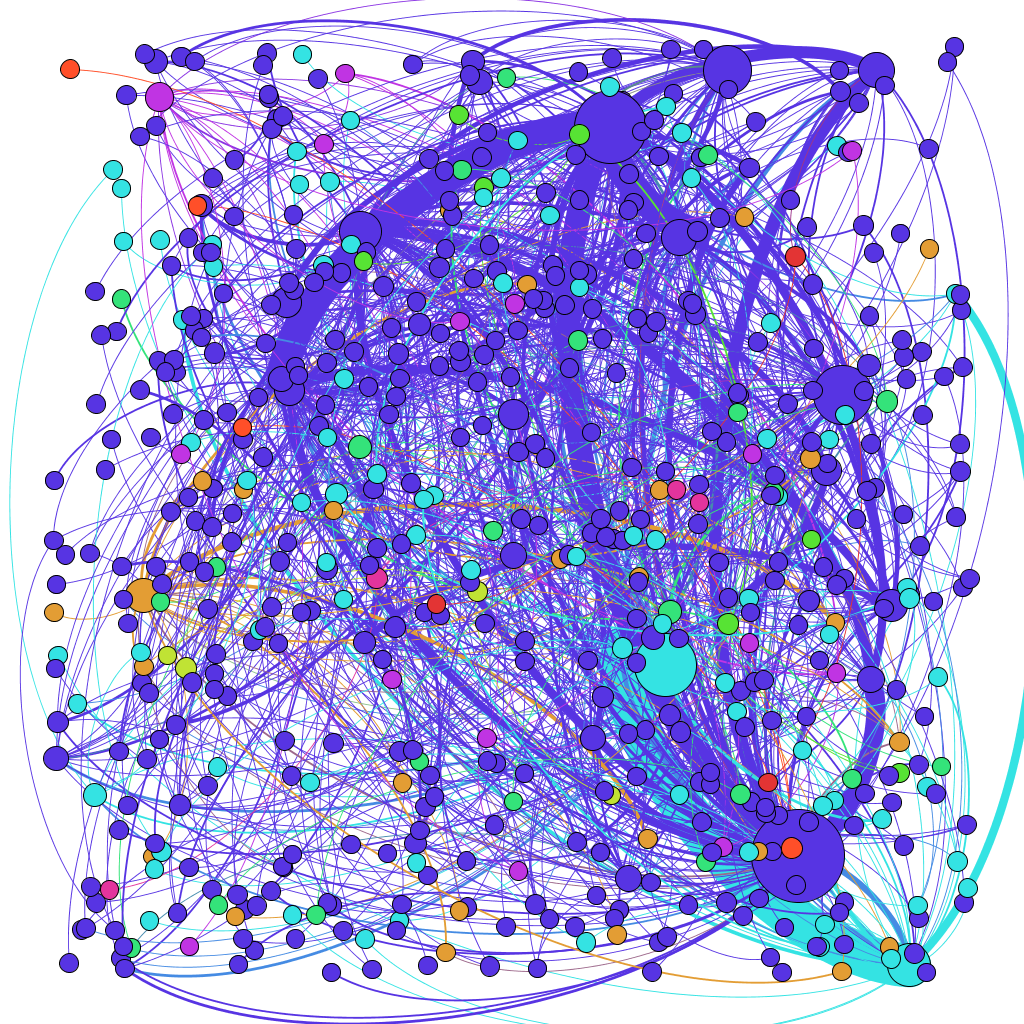
These pictures are the analysis of doing the following steps:
- Performed the following operations on the blog and Twitter networks for week 12, after importing either network (one file at a time) in Gephi as undirected files:
- Compute the density measure of the networks
- Compute centrality measures (betweenness and degree) introduced in the course
- Apply the Giant Component filter to filter out all the disconnected nodes and identify communities by using the modularity algorithm.
- Color by the module, size by the betweenness centrality measure.
Some points to note in these graphs are:
- Blog dataset had a very better graph density of 0.01 whereas the twitter dataset had a much lower graph density of 0.003 as there were many more nodes and edges in twitter graph and they were that much dense. The communities were densely connected but not the graphs themselves.
- For blog the average degree was 2 versus 2.7 for the twitter dataset so each node on average was more connected in twitter users than the blog users.
- For blog the network diameter was 7 versus 8 so there is not much significant difference in terms of the network diameter.
- Average path length was 3 for blog versus 3.4 for twitter. Not much to discuss here.
- For blog default there were 7 communities versus 201 communities for twitter so i had to reduce the communities by changing the resolution to 2.5 to get around 10 communities as otherwise it was too difficult to visualize the dataset. With even 10 communities it was difficult to explore the communities due to the large number of nodes and edges in twitter dataset.
Communities for Blog CCK11 Dataset


One Comment