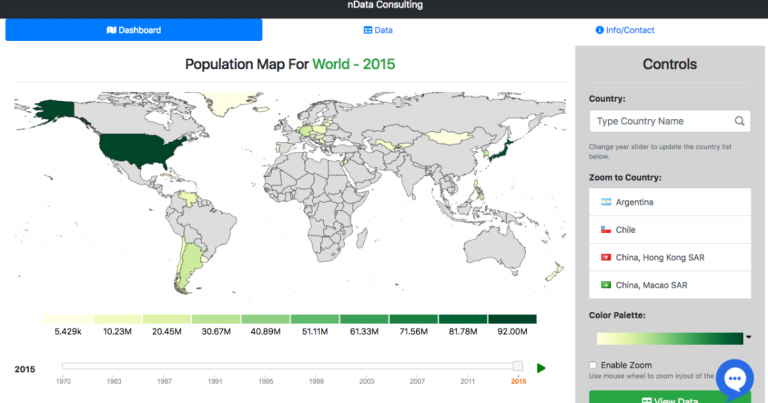
World & Country Population Map
Introduction This World population dashboard allows to interactively explore global population data from years 1970-1995 for over 200 countries. This dashboard allows you to dig deeper into each country by visualizing population data for each city. This visualization uses census data collected by United Nations Statistics Division(UNSD). This dashboard integrates data from multiple sources to…


